Illustration / Infographics

The pharmaceutical industry, particularly in manufacturing, operates with a vast amount of data. Research findings, different time periods, and complex interaction schemes are all challenging for the human brain, which is naturally inclined to process visual images as its primary channel for information intake.
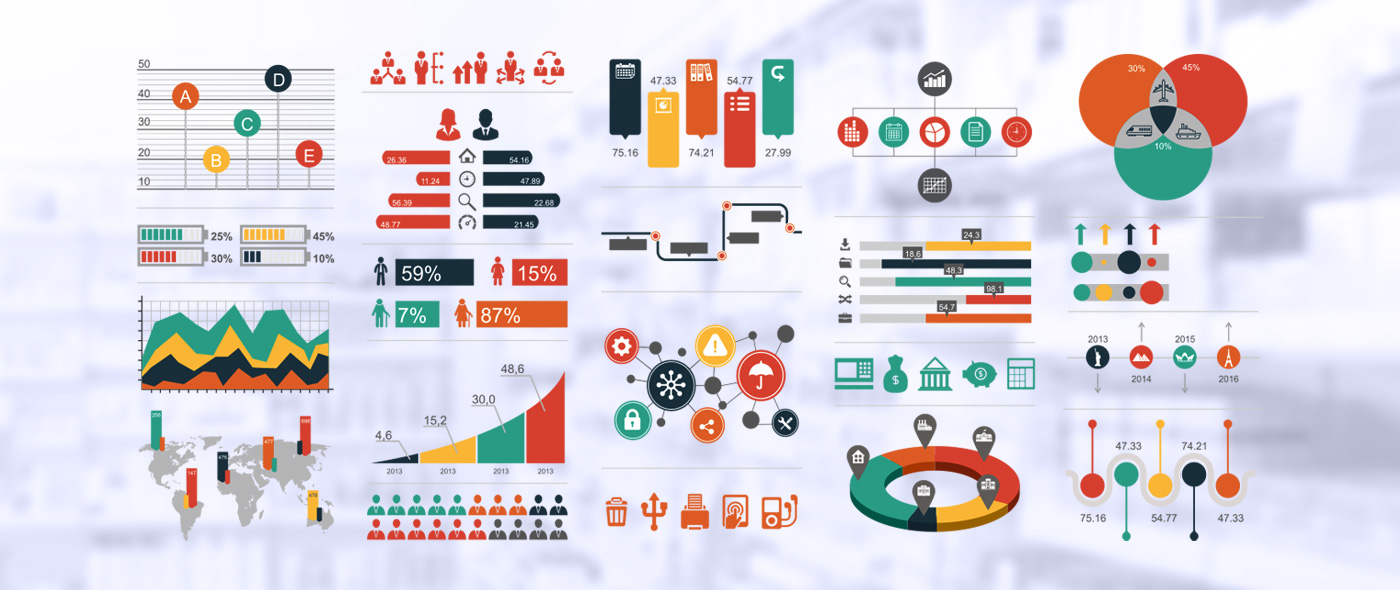
In this case, illustrations, infographics, and diagrams come to the rescue. Illustrating processes and visualizing quantitative data and their proportions allow for an immediate assessment of the scale of results. A well-structured, icon-supported diagram can help better understand the process and significantly reduce the chance of errors, whether it's a diagram in a presentation for a broad audience or a specialized instruction for a production operator.
Moreover, illustrations and infographics designed in alignment with the company’s corporate style also contribute to brand image and are an integral part of brand identity.
In addition to functional infographics and charts, illustrations as an artistic form can convey emotional messages, shaping the overall impression of a layout and setting the tone for the entire publication.
Tarqvara Pharma Technologies specialists are ready to assist both with visualizing schemes and data, making them as accessible as possible to the audience, and creating custom illustrations by professional illustrators working in various styles. In addition to years of experience in graphic design, we deeply understand the nuances of the pharmaceutical industry, allowing us to see and address aspects that may go unnoticed by standard design agencies.
See also:
Branding / CVI / Logo
Printing Materials / Pagemaking
Pharmaceutical Packaging
Technical Animation
Creating Presentations
Web-Design
